A single coverage estimator for use in SQUEAC, SLEAC, and other CMAM coverage assessments
 By Safari Balegamire (VALID International), Katja Siling (World Food Programme), Jose Luis Alvarez Moran (Coverage Monitoring Network), Ernest Guevarra (VALID International), Sophie Woodhead (Coverage Monitoring Network), Alison Norris (VALID International), Lionella Fieschi (VALID International), Paul Binns (VALID International), and Mark Myatt (Brixton Health)
Location: Global
What we know: There are two different estimators of coverage (point coverage and period coverage) using current coverage assessment methods. Selection of the appropriate estimator can be difficult in multi-district surveys and where contextual information is not readily available. Coverage assessed using different estimators is not comparable.
What this article adds: A new single coverage estimator is proposed that is a measure of overall programme performance. It can be used with existing survey tools and calculated using previous coverage data. Uncertainty remains regarding the mean length of an untreated SAM episode (included in the calculation); work is ongoing in this regard. The authors recommend the proposed single coverage estimator should be used in preference to using either the point or period coverage estimators.
Introduction
This article has been prompted by the number of support requests received from SQUEAC and SLEAC practitioners regarding the two different estimators of coverage (i.e. point coverage and period coverage, see definitions below) in current use. Both of these estimators can be calculated using data from any of the currently used coverage assessment methods (i.e. CSAS, SQUEAC, SLEAC, S3M) but often produce very different results. The SQUEAC and SLEAC technical reference encourages investigators to select and report only the most appropriate estimator, with the choice of the most appropriate estimator being informed by the context:
- If the programme has good case-finding and recruitment, short lengths of stay, and low levels of defaulting then the period coverage estimator is likely to be the most appropriate estimator.
- If the programme has poor case-finding and recruitment, long lengths of stay due to late presentation and/or late admission, and high levels of defaulting then the point coverage estimator is likely to be the most appropriate estimator.
Selection of the most appropriate coverage estimator for a programme has proved difficult in multi-district (e.g. national) SLEAC surveys. It is unlikely that one estimator is appropriate for all sub-programmes, and collecting the contextual information needed to select the estimator appropriate to each sub-programme may not be feasible. Even when contextual information is collected, the use of different estimators makes it difficult to make between sub-programme comparisons. Reporting both point and period coverage estimates is a potential solution but this tends to confuse policy makers and has, on occasion, generated resistance to survey results.
This article presents a new single coverage estimator that does not require new survey tools to be developed and tested and can be used with current survey tools and data from previous coverage surveys so as to ensure continuity and comparability.
Coverage estimators
The two coverage estimators in current use are calculated as follows:

and:

where:
Cin = Current SAM cases in the programme
Cout = Current SAM cases not in the programme
Rin = Recovering SAM cases in the programme
Achieving high levels of coverage requires:
- Timely case-finding and recruitment. This maximises the proportion and number of cases of uncomplicated SAM admitted to the programme. This leads to high cure rates and short lengths of stay, which in turn leads to good impressions of the programme in the beneficiary population, early treatment seeking, and low levels of defaulting.
- Good retention from admission to cure. Defaulting is associated with poor response to treatment and negative outcomes after defaulting, which leads to poor impressions of the programme in the beneficiary population, poor recruitment and late treatment seeking.
These and other factors often interact with each other in complex ways (see Figure 1).
The two coverage estimators in current use focus on case-finding, recruitment, and retention:
- Point coverage reflects the ability of a programme to find and recruit cases. The point coverage estimator does not account for recovering cases and so does not directly reflect the programme's ability to retain cases from admission to cure. This means that it may give a misleading (i.e. downwardly biased) picture of programme performance. This is a particular problem with programmes that recruit cases very soon after they meet programme admission criteria and are likely to be treating large numbers of recovering cases. In these programmes, the point coverage estimator will “penalise” good performance.
- Period coverage is intended to reflect the ability of a programme to find, recruit, and retain cases. The period coverage estimator does directly reflect the programme's ability to retain cases from admission to cure but tends to overestimate programme performance because the denominator does not include recovering cases that are not in the programme. The period coverage estimator also overestimates programme performance when cases are retained in a programme after meeting the criteria for being discharged as cured.
An estimator of coverage that does include both recovering cases that are in the programme and recovering cases that are not in the programme and, thus, provides an unbiased estimator of overall programme performance is:

where:
Rout = Recovering SAM cases not in the programme
The problem with this estimator is that Rout (i.e. the number of recovering cases that are not in the programme) is unknown and may be difficult to collect accurately. A survey might (e.g.) find a moderate acute malnutrition (MAM) case that was not in the programme but it would not be easy to ascertain, except in the case of a defaulter, whether this case had previously been a SAM case and was now a recovering SAM case. Also, we know that the active and adaptive case-finding procedure used in many CMAM coverage surveys is optimally biased to find SAM cases not MAM cases. It could be argued that the MAM cases that we do find using active and adaptive case-finding are likely to be recovering SAM cases. This assumption would not, however, be tenable with house-to-house and door-to-door screening which is often used when case-finding in urban and camp settings. The situation may, however, be complicated by the presence of nutrition programmes distributing lipid nutrient supplements (LNS) such as NutriButter®, Plumpy'DozTM, or Plumpy'SupTM. Despite these complications it may be possible to create a simple instrument to divide MAM cases into “MAM never SAM” and “MAM previously SAM”. Such an instrument need only be accurate “on-average”.
It may also be possible to address the problem of estimating the number of recovering cases not in the programme (Rout) using a simple mathematical model. This article explores the latter approach. The advantage of this approach is that the single coverage estimator could be applied to data from previous coverage surveys allowing comparability of coverage estimates over time and would require no changes to be made to existing methods and tools.
A simple mathematical model
If we assume that incidence and coverage do not change very rapidly over time (i.e. little or no change over a period of less than about two months) then we can also assume that:

where k is a correction factor (more on this below).
We can express Rout (the unknown variable) in terms of the known variables:

To avoid having a division by zero in the case of a survey finding no current SAM cases in the programme being assessed we would use:

Fractions of cases can be removed by rounding to the nearest whole number using simple truncation (i.e. rounding towards zero):

This leaves us with the problem of deciding a suitable value for the correction factor (k). A reasonable candidate for k is the ratio of the mean length of an untreated episode to the mean length of a CMAM treatment episode. Suitable values might be:
Parameter |
Value |
Notes |
|
Mean length of an untreated episode |
7.5 months** |
This value is commonly used when estimating future programme case-loads from prevalence estimates*. |
|
Mean length of a successful treatment episode |
2.5 months** (i.e. about 10 weeks) |
This value can be estimated from routine programming monitoring data (already collected and calculated in SQUEAC assessments). A value of 2.5 months could be used in the absence of better information or when the validity of routine programme monitoring data is suspect, such as when defaulters are recorded as being cured or when cases are retained in a programme after meeting the criteria for being discharged as cured. |
|
* The value of 7.5 months for the mean untreated episode length is from: Garenne M, Willie D, Maire B, Fontaine O, Eeckels R, Briend A, Van den Broeck J, Incidence and duration of severe wasting in two African populations, Public Health Nutrition, 2009;12(11);1974-1982. Available from http://www.ncbi.nlm.nih.gov/pubmed/19254427 ** These values are expressed using the same summary statistic (i.e. the mean) and the same unit of measurement. |
||
Using these values gives:

and:

 Applying the model
Applying the model requires two steps:
- Calculate Rout using a reasonable estimate for k with Cin, Cout, and Rin from survey data.
- Estimate coverage using the single coverage estimator.
To illustrate this process we will apply our model to some familiar example data (see Table 1).
Table 1: Apply the single coverage estimator to example data |
||||||
Source |
Survey data |
Point coverage |
Period coverage |
Preferred estimator* |
Single coverage estimate |
|
| 1 |
FANTA (p105)** |
Cin = 0 Cout = 2 Rin = 34 |
0% |
94.4% |
Period |
 |
| 2 |
FANTA (p105)** |
Cin = 3 Cout = 9 Rin = 22 |
25% |
73.5% |
Point |
 |
* The estimator indicated as being the most appropriate by analysis of SQUEAC data.
** The data used in these examples is presented and discussed on page 105 of: Myatt M, Guevarra E, Fieschi L, Norris A, Guerrero S, Schofield L, Jones D, Emru E, Sadler K, Semi-Quantitative Evaluation of Access and Coverage (SQUEAC) / Simplified Lot Quality Assurance Evaluation of Access and Coverage (SLEAC) Technical Reference, Food and Nutritional Technical Assistance III Project (FANTA-III), FHI 360 / FANTA, Washington, DC, October 2012. Available from: http://www.fantaproject.org/monitoring-and-evaluation/squeac-sleac
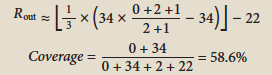
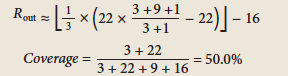
The inclusion of recovering cases means that the single coverage estimate is mathematically constrained to return a coverage estimate that is greater than or equal to the point coverage estimate. In both of the examples shown in Table 1, the single coverage estimate is higher than the point coverage estimate. The underestimation present in the point coverage estimate has, to some extent, been corrected.
The inclusion of recovering cases that are not in the programme means that the single coverage estimator is mathematically constrained to return a coverage estimate that is less than or equal to the period coverage estimate. In both of the examples shown in Table 1, the single coverage estimate is lower than the period coverage estimate. The overestimation present in the period coverage estimate has, to some extent, been corrected.
We would use the process illustrated in Table 1 with data from simple coverage estimation surveys using (e.g.) the CSAS or S3M survey designs.
Using the single coverage estimator with data from SQUEAC hypothesis testing surveys or SLEAC surveys requires applying the standard LQAS decision rules with d or d1 and d2 calculated from n which is the denominator of the single coverage estimator (see Table 2).
Table 2: Applying the single coverage estimator to example data (SLEAC) with coverage thresholds of p1 = 20% and p2 = 50% |
||||||
Source |
n* |
d1 |
d2 |
Covered |
Coverage class |
|
| 1 |
FANTA (p105) |
0+34+2+22=58 |
 |
 |
34 |
HIGH |
| 2 | FANTA (p105) |
3+22+9+16=50 |
 |
 |
25 |
MODERATE |
* The denominator for the single coverage estimator. The data and calculations for each n are shown in Table 1.
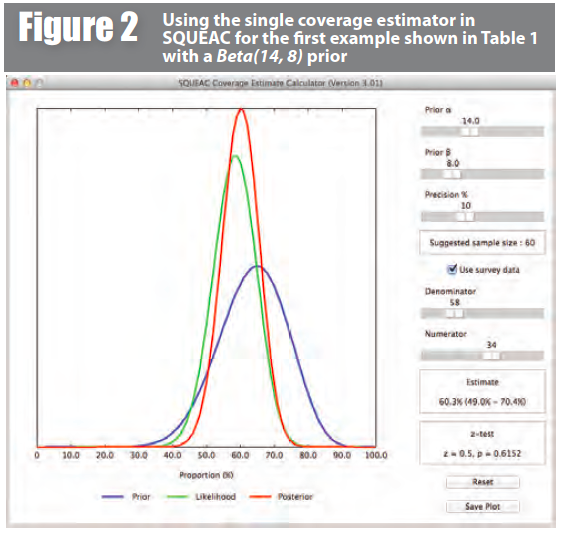
Using the single coverage estimator in final-stage SQUEAC surveys requires specifying the numerator and denominator of the single coverage estimator as the likelihood (survey) data. Figure 2, for example, shows a Bayesian beta-binomial conjugate analysis performed using the BayesSQUEAC calculator with data from the first example in Table 1 with a Beta(14, 8) prior. In this case the numerator is:

and the denominator is:

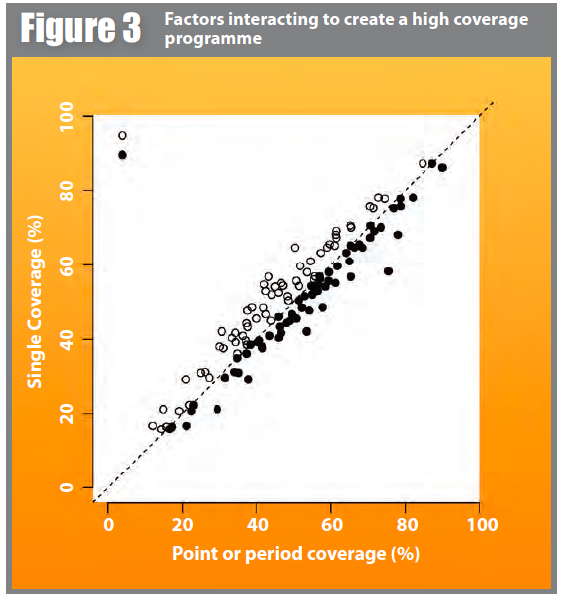
 We also applied the point coverage, period coverage, and single coverage estimators to sixty-four surveys from SQUEAC assessments (i.e. SQUEAC stage three likelihood surveys) undertaken between 2009 and 2014 by the Coverage Monitoring Network (CMN) and VALID, assessing the coverage of CMAM (predominantly SAM treatment) programmes operating in Afghanistan, Angola, Bangladesh, Burkina Faso, Cameroon, Chad, Djibouti, Ethiopia, Haiti, Ivory Coast, Kenya, Mali, Mauritania, Niger, Nigeria, Rwanda, Senegal, Sierra Leone, Somalia, South Sudan, and Sudan. All three estimates were calculated using the conjugate prior used for the original surveys. The single coverage estimates were calculated using k = 3 when calculating Rout for all surveys. Figure 3 shows a scatter-plot of the point coverage and period coverage estimates against the single coverage estimates calculated from each of the sixty-four surveys. All of the plotted points for the point coverage estimates lie on or above the line of equality (if no correction is made then all of the plotted points will fall on this line). This is consistent with the single coverage estimator correcting the tendency towards underestimation of the point coverage estimator. All of the plotted points for the period coverage estimates lie on or below the line of equality (if no correction is made then all of the plotted points will fall on this line). This is consistent with the single coverage estimator correcting the tendency towards overestimation of the period coverage estimator.
 Conclusions
The proposed single coverage estimator provides a measure of overall programme performance with respect to coverage which has face validity, corrects the biases of the point and period coverage estimators, can be applied to data from previous coverage surveys, and requires no change to existing coverage assessment methods and tools.
The single coverage estimator may be used for tracking coverage over time using historical and current coverage survey data. Coverage estimates will need to be calculated using the single coverage estimator with all data. This will usually be possible as most coverage survey reports include the relevant data.
 Uncertainty remains regarding the mean length of an untreated SAM episode. Work on estimating this for the purposes of estimating programme caseloads in typical emergency and development contexts is currently being done by MSF and Epicentre. The mean length of a successful treatment episode should, whenever possible, be estimated from programme data. The default mean length of a successful treatment episode used in this article (i.e. ten weeks) should be reviewed using programme data and revised accordingly.
The proposed single coverage estimator should be used in preference to using either the point or period coverage estimators.
For more information, contact: Mark Myatt, email: mark[at]brixtonhealth.com