
Costs, cost-effectiveness, and financial sustainability of CMAM in Northern Nigeria
 By Sasha Frankel, Mark Roland and Marty Makinen
 Sasha Frankel worked for the Results for Development Institute as a Senior Programme Associate focusing on health financing and costing work in Ghana and Nigeria. She is currently pursuing a Master in Public Affairs at Princeton’s Woodrow Wilson School of Public and International Affairs.
 Mark Roland is a Senior Programme Officer at the Results for Development Institute. His work, which spans the education and health sectors, focuses on programme evaluation and analyses of cost and financial sustainability.
 Marty Makinen is a Managing Director at the Results for Development Institute. He is a health economist with more than 30 years of experience and has worked extensively in the areas of health financing and the economics of nutrition.
Results for Development Institute (R4D) was supported by consultants Joel Lehmann – who provided technical support to the study and instrument design, as well as training and field supervision – and Bryan Plummer, who assisted in data cleaning and analysis. For on-the-ground data collection, R4D worked with Binomial Optimus Limited (BOL), an evaluation firm based in Abuja, Nigeria. BOL co-managed the data collection effort, including recruitment, training, and supervision of enumerators. Initial instrument development was supported by Health Systems Consult, Ltd. This analysis was made possible thanks to the support of the Children’s Investment Fund Foundation (CIFF). The report benefited from strong technical guidance from a number of counterparts at CIFF, in particular Amy Mayberry.
Background
To date, the evidence on the efficacy and cost-effectiveness of CMAM has been encouraging. Previous studies suggest that CMAM can reduce the cost and barriers to access associated with inpatient care, and in certain contexts, reduce mortality. This study1 provides an estimate of the cost, cost-effectiveness, and financial sustainability of the CMAM programme in northern Nigeria based on data collected in four states.
This information is intended to equip government, external financers, and programme implementers with data to inform decisions around programmatic expansion. Cost and financial sustainability data will allow the Nigerian government, at both the federal and state levels, to understand what financial actions must be taken to ensure that sufficient resources are directed toward the CMAM programme. Cost-effectiveness data can help policymakers understand the value of their investments in CMAM relative to alternatives and provide evidence to help make the argument for appropriate budgetary commitments.
Methodology
The categorisation of costs varies across similar studies conducted to date,2 as do the methods used to collect cost information. This study uses a “bottom-up” methodology, in which data about cost line items were gathered through facility-level interviews rather than relying upon existing budgets/programmatic reporting. As a result, this study appears to have assembled a more robust and comprehensive estimate of costs associated with obtaining CMAM treatment (through inclusion of items not found in official CMAM budgets, such as proportion of facility overhead costs).
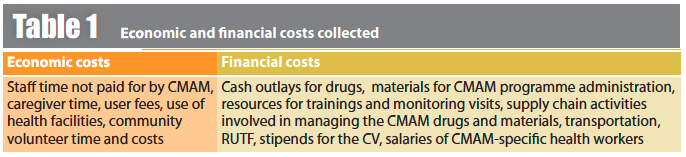
Economic vs. financial costs
Total cost per child cured includes several cost components that can be categorised as either financial or economic. Financial costs or cash outlays are those that support the functioning of the CMAM programme and economic costs are costs borne by the economy as a whole (including opportunity cost). Examples of both types of costs can be found in Table 1. Inclusion of both financial and economic costs in costing analyses is crucial to understand the full cost of the programme. Financial costs only are used for the cost-effectiveness and fiscal space analysis to represent the estimated cost to government and UNICEF in this scenario.
Study design and settings
Costs were observed at eight organisational levels and specific survey instruments were then developed for each level to elicit relevant cost information. Table 2 lists each of them, along with the cost elements collected.

Sampling
Four of the eleven CMAM states in northern Nigeria were selected for the study: Bauchi, Jigawa, Sokoto and Kano, with security being a primary criterion for selection. Data were collected in four waves, conducted quarterly from 2013-2014 to take into account seasonal variations (see Table 3). Within each state, three of the LGAs where CMAM services are delivered were randomly sampled to participate in the survey3. Within each LGA there are multiple OTPs, one of which was selected at random to participate in the study. A total of 25 different LGAs, 25 SCs, and 40 OTPs participated in the study across the four waves.
Data collectors used the survey instrument to interview a focal person in each state, LGA, OTP, and SC, so for each wave there were a total of four respondents at the state level, and 12 at each LGA, OTP, and SC level. At the state level, the focal person was typically the State Nutrition Officer (SNO), although in a few cases, when the SNO was unavailable, the Assistant SNO or the Community Health Officer was interviewed. At the LGA level, the Nutrition Focal Person or their deputy were interviewed. At the OTP, data collectors identified the health workers most directly involved with provision of CMAM services. If that person was unavailable, the next most senior person at the OTP was interviewed. At the SC, the CMAM focal person was interviewed.

Results
Costs
Cost per child cured. The cost per child cured estimate includes all costs collected from organisational levels, both economic and financial costs, as well as costs associated with SAM patients who either died or defaulted, meaning they did not complete treatment. Our findings show that for every 1,000 children who complete treatment, 17 children die and 254 default on average across the four states.
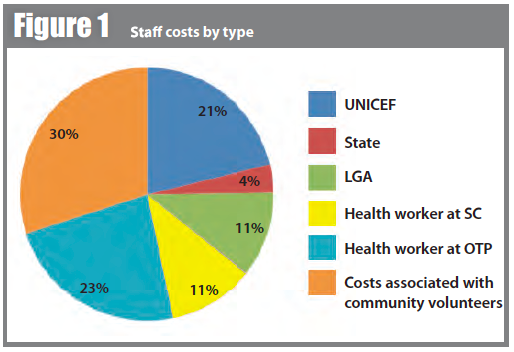
The comprehensive average cost per child cured4 is $219, of which $160 (73%) are financial costs borne by the government and UNICEF and $59 (27%) are economic costs. This cost was predominantly driven by RUTF, staff, and out-of-pocket costs, which together comprise more than 85% of total costs (see Table 4). RUTF constitutes the single largest share of total costs: for every child cured, $76 worth of RUTF was needed. Of nearly identical magnitude were staff costs, which comprise 34% ($74 dollars per child cured). Staff costs were drawn from salaried and non-salaried actors, with non-salaried CVs accounting for almost a third of staff costs through stipend, transportation and opportunity costs.5 The remaining 15% of costs are comprised of opportunity costs, supply chain, drugs, monitoring, overhead, and training costs.

Staff costs by type. Staff costs, which are the second largest driver of costs, were drawn from salaried and non-salaried actors. Non-salaried community volunteers account for nearly a third of staff costs, which includes opportunity cost, stipend and transportation for the CVs (see Figure 1).
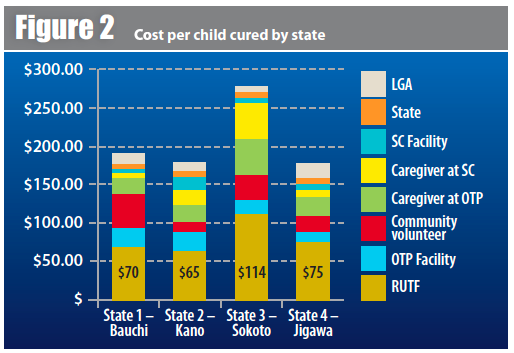
Cost per child by state. It is important to highlight that costs per child cured varied across states, from $175 in Jigawa and Kano to $273 in Sokoto, reflecting a range of contexts in which the programme is operating6 (see Figure 2). Although Sokoto’s annual costs are the second-lowest among all states, the number of children reported to be cured in those OTPs is less than half as many as in the other OTPs. The number of RUTF issued per patients cured is also highest in Sokoto (133 sachets in Sokoto compared to 115 on average across the other states). This means that more patients default and die per patient cured in Sokoto than in other states, so for every one patient cured, the OTPs give out relatively more RUTF - including to patients who are not getting cured - which may contribute to Sokoto’s higher costs. Sokoto had similar cure rates to the other states and did not have the highest rate of defaulters. However, it had the highest rate of deaths per 1,000 admissions at 25 compared to 8, 17, and 19 in Bauchi, Kano, and Jigawa respectively. However, RUTF as a percentage of total cost did not vary greatly across states, ranging from 36% of total costs in Kano to 42.6% of total costs in Jigawa.
Cost effectiveness
The financial costs described above were used for the cost-effectiveness analysis to estimate the cost to government and donors to deliver treatment. CMAM treatment in the four states included in this study was estimated to cost $1,117 per death averted7 and $30 per Disability-Adjusted Life Year (DALY) gained,8 which situates it favourably among existing literature that calculates CMAM cost per death averted. In calculating cost per death averted, a 15.7% mortality reduction for those cured is estimated, based on Bachmann 2009,9 but adjusting for Nigeria's implied untreated death rate (18.5%) and background mortality rate (2.9%). Cost per death averted ($219) is considerably higher than cost per death cured since not every child cured would have died; SAM may incapacitate or otherwise disable those who do not die.
The WHO deems interventions where cost per death averted is below GDP per capita as highly cost-effective; cost-effective if between one and three times GDP per capita, and not cost-effective if more than three times GDP per capita.10 In 2014, average GDP per capita in Nigeria was approximately $3,000, suggesting that the CMAM intervention is highly cost-effective.11 Perhaps more importantly, GDP per capita in the four states where the study was conducted ranged from $983 in Bauchi to $1,274 in Sokoto,12 further suggesting CMAM is cost-effective in Northern Nigeria.
Financial Sustainability Analysis
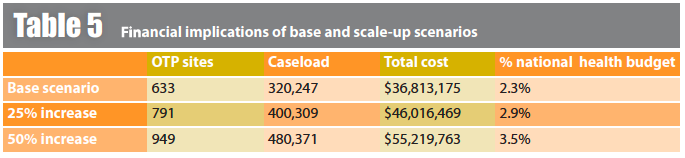
The average total financial cost of CMAM to scale up will be up to $160 per child cured. For an average OTP site, with over 500 admissions and 360 children cured per year,13 estimated cost is $58,157 per year. From this, we can estimate that the total financing needed to support an average LGA with five OTPs would be approximately $290,783. While these costs are not insignificant, they are affordable. As of March 2015, CMAM is functioning in 633 OTPS in 97 LGAs, yielding a total cost of $36,813,175, which represents 2.3% of the 2014 national health budget14 and $0.20 per capita. As Nigeria looks forward to the future of the CMAM programme and potential scale-up to meet the unmet burden, it is important to understand the financial implications. Scale-up scenarios to cover up to nearly half a million children per year are detailed in Table 5.
Financial sustainability thresholds developed by R4D suggest that, while the costs are by no means crippling relative to available domestic resources (especially in light of the potential number of lives saved), concerted effort should nevertheless be paid to the financial sustainability of the CMAM programme.
Discussion
At $219, the cost per child cured in the CMAM programme is comparable to cost estimates in other studies. Other studies do not necessarily include the costs of community volunteers and most rely upon programme budgets, which have the effect of producing lower cost estimates, making the estimate for this study even more encouraging.
RUTF is the major cost driver for the CMAM programme, comprising approximately 35% of total costs and close to 50% of financial costs. As such, some investment in strategies to reduce RUTF costs could prove worthwhile. Sensitivity analysis is illustrative insofar as it reveals how reductions in the cost of RUTF can provide moderate savings. For example, a 25% reduction in the cost of RUTF would provide a savings of $16, or 7%, of the total cost per child treated.
Additionally, efforts to increase the effectiveness and maximise efficiencies in the programme could also reduce total costs.
Costs associated with community volunteers are responsible for approximately 10% of total costs, and 30% of all staff time costs. The costs of community volunteers relate to their opportunity cost, i.e. the economic value of their time and their implicit lost wages. While CVs contribute significantly to the economic costs, not all of these costs are actually compensated. As a result, care should be taken to ensure that an adequate supply of quality CVs continue, given that compensation does not match the true economic value of their contributions. Qualitative data from the evaluation support the idea that some diminution of interest over time on the part of CVs is present.
While the financial sustainability numbers suggest that fiscal space constraints should be considered, the low programmatic costs and encouraging cost-effectiveness estimates indicate high value for money, especially relative to other potential health investments. As such, the case for further investment in the programme is a compelling one.
For more information, contact: Mark Roland, email: mroland@r4d.org
1Frankel S, Roland M, Makinen M (2015). Costs, Cost-Effectiveness, and Financial Sustainability of Community-based Management of Acute Malnutrition in Northern Nigeria. Results 4 Development Institute, June 2015
2Cost per child cured in other examined studies are as follows: Ethiopia: $135 (Tekeste et al), Malawi: $169 (Wilford et al), Bangladesh: $180 (Puett et al), Zambia: $203 (Bachmann), Indonesia: $332 (Purwesti), Ghana:$805 (Abdul-Latif)
3In Bauchi, there were only three intervention LGAs which were automatically selected for all four waves.
4This assumes a 72% cure rate found in the sites where data was collected.
5Opportunity cost was calculated through self-reported proportion of time spent on CMAM activities and selfreported income by caregivers.
6Cost per child cured by state is as follows: Bauchi $188, Jigawa $175, Kano $175, and Sokoto $273.
7Cost per death averted is calculated using total programme costs over 10 years. Costs include all financial outlays, including human resources, monitoring, training, worker compensation, RUTF, medicine, and inpatient costs. Total deaths averted is calculated as follows: (Estimated caseload x mortality reduction for those cured x weighted cure rates for outpatient and inpatient services).
8This study estimates 37 DALYs gained per death averted. Total DALYs gained is calculated by multiplying DALY gained per death averted by the estimate of deaths averted. Cost per DALY gained is calculated by dividing total projected programme costs over 10 years by total DALYs gained.
9Bachmann MO. Cost effectiveness of community-based therapeutic care for children with severe acute malnutrition in Zambia: decision tree model. Cost Effectiveness and Resource Allocation 2009;7:2.
10WHO Cost-effectiveness thresholds http://www.who.int/choice/costs/CER_thresholds/en/
11World Bank 2013 current dollars http://data.worldbank.org/indicator/NY.GDP.PCAP.CD, accessed 4/23/15
12All figures in 2010 USD, http://services.gov.ng/states accessed 4/23/15
13This assumes a 72% cure rate found in the sites where data was collected.
14This calculation uses the 2014 Appropriations Bill which establishes a FMOH Budget of 262,742,351,874 Naira. We use an exchange rate of 167 Naira per dollar.