
Special focus: Wasting patterns in Somalia
Gwenaelle Luc (Food and Agriculture Organization (FAO)), Modibo Keita (FAO), Baguinébié Bazongo (FAO), Brahima Diarra (FAO), Angelina Virchenko (FAO), Claudia Okley (FAO), Tiphaine Seyvet (FAO), Yannick Ngongang Mbunang (FAO), Daniel Molla (FAO), Dunja Dujanovic (FAO), Abukar Nur (FAO), Anastasia Marshak (Feinstein International Center, Tufts University), Afaf Rahim (Brussels School of Governance), Abdal Monium Osman (FAO).
What we know: Few studies analyse food insecurity or malnutrition at the community level, potentially missing key community drivers and more localised basic causes of these outcomes. Moreover, the complex relationship between wasting and food insecurity over seasons and livelihood zones remains poorly understood.
What this adds: In this extended article, we examine the spatial clustering of child wasting before investigating the spatiotemporal relationship between child wasting and food insecurity in rural Somalia. We observed clustering of child wasting and household food insecurity at the community level within districts and livelihood zones – suggesting the influence of community-level drivers. We also observed two distinct seasonal peaks in child wasting, yet these peaks did not align with food insecurity trends, where a decrease in wasting prevalence during the lean season was seen. Conclusively, this study reveals the need for increased attention to collecting and analysing data in a way that captures context-specific spatial and temporal variations in food insecurity and wasting. Most importantly, our findings suggest that capturing the drivers of food insecurity and wasting is needed to support locally appropriate interventions and outcomes.
Part 1:
An introduction to Somalia
In Somalia, despite long-term humanitarian, development, and peace interventions, food insecurity has typically remained above Integrated Food Security Phase Classification (IPC)1 ‘Crisis’ levels (Phase 3+) over the last three decades. Based on the latest food security IPC analysis from January to March 2024, approximately 3.2 million people (17% of the population) are IPC Phase 3 (crisis) and around 800,000 people (4% of the population) are experiencing worse conditions – IPC Phase 4 (emergency). Between January and December 2024, a projected 1.7 million children aged 6–59 months face wasting, including 430,000 who are likely to be severely wasted. Overall, wasting prevalence has consistently exceeded the 15% emergency threshold for global acute malnutrition.
Although tools such as the IPC and other national food systems diagnostics are used to assess food insecurity and malnutrition in Somalia, evidence gaps remain in understanding the complexity of wasting drivers and food insecurity and how the two are linked. Despite ongoing collective efforts at prioritising local and context-specific knowledge, data is frequently aggregated across time and space. Such a gap can be addressed by collecting more granular spatial and temporal data.
This granularity is important, as current literature highlights a geographical clustering of food insecurity and malnutrition at lower administrative levels (Luc et al., 2023), which has cost-efficiency‑ implications for programmes. Moreover, current hunger analysis systems2 and studies show that food insecurity and wasting vary according to livelihood systems and seasons (Chotard et al., 2010; Martin-Canavate et al., 2020). An analysis of variation in wasting prevalence in Somalia found more significant seasonal variation than annual variation on average (Kinyoki et al., 2017). Several studies in Somalia have also reported associations between systemic drivers of hunger, such as climatic conditions and conflict, and persistent levels of wasting.
Production systems in Somalia
Rural Somalia has three main livelihood zones: pastoral, agropastoral, and riverine/farming. Dominant livelihood systems vary from one community area to another. Local factors such as ethnicity, traditional knowledge, vulnerability to climate and manufactured shocks, and access to markets and natural resources all influence the predominant livelihood zone. While pastoralist livelihood zones seem to be more affected by food insecurity over the years, wasting prevalence is higher in riverine and agropastoral zones in central and southern Somalia (IPC, 2024).
Seasonality in rural Somalia
Somalia is generally arid and semi-arid, with bimodal rainfall influenced by the Inter-Tropical Convergence Zone (the north–south movement resulting in two rainy seasons and two dry seasons per year). ‘Jilaal’ is the most extended dry season (January to March), characterised by livestock migration and decreased milk production among pastoralist systems. Jilaal is followed by ‘Gu’, Somalia’s heaviest and most reliable rainfall season (April to June). About 70% of annual crop and livestock production depends on the Gu rains, with the Gu harvest following (July and August). The Gu season is characterised by increased pasture and water availability for the livestock and increased availability of milk, fruits, and vegetables, including the peak period for production of ghee (a liquid butter made from milk).
Subsequently, there is the ‘Hagaa’ dry season (July to September), with light coastal Hagaa rains in July and August. The Hagaa season is followed by the ‘Deyr’ rainy season (October to December). Deyr rains are less widespread and less reliable than the Gu rains. They are usually patchy and localised. Deyr harvest is normally expected between December and January, providing the food needed to take households through the Jilaal season. Deyr harvest is usually not as substantial as the main Gu harvest.
Typically, household food stocks last about seven months per year, although production volume determines when their stocks are depleted and their lean season starts. The peak hunger season in cropping areas is toward the end of the Gu rains (late May/mid-June), when household stocks are depleted and agricultural activities cease. Below-average precipitation usually results in diminished production. However, rainfall distribution is equally, if not more, important. Heavy rains over a short period can lead to flash floods, causing crop devastation.
The pastoral production year starts with the onset of the Gu rainy season (April) when most livestock species give birth, and households have access to their milk and meat for consumption and sale. The Gu rainy season is when most pastoral households can access sellable animals and animal products, which can help repay accumulated debt to maximise non-staple food purchases and other essentials. Milk consumption and production are directly related to the seasonality of livestock conception. Goats tend to conceive during the onset of rains (April and October), while camels mainly conceive in the mid-rainy period (May and November) and cattle at the end of the seasonal rains (June and December). Similarly, kidding/calving rates are high in March and September for goats, May and December for camels, and August for cattle – with milk consumption increasing accordingly.
The two dry seasons, Jiilaal (January–March) and Hagaa (July–September) break the two rainy seasons, resulting in pasture and water scarcity and leading to seasonal migrations in search of water and pasture. The seasonal lean period for the livestock corresponds to the end of the dry season when animal body conditions deteriorate and milk yield decreases.
Recent studies on seasonality in African drylands have found that food insecurity and wasting indicators might have a more complex relationship and do not move in tandem during all seasons and across all livelihood zones (Kinyoki et al., 2017). For example, research in Chad, Sudan, and South Sudan shows that wasting prevalence is highest at the end of the dry season and the start of the rainy season, with a much smaller secondary peak before the harvest when food insecurity is at its highest (FAO & Tufts University, 2019). This indicates the role of different drivers at different times of the year. The recent Adapted Nutrition in Africa's Drylands Framework from UNICEF highlights the crucial role of considering fundamental and more systemic drivers of wasting and food insecurity, focusing on seasonality, livelihood systems, conflict, and climate (Young, 2020).
Part 2:
Methods
Primary data sources for this study include the Food Security and Nutrition Analysis Unit (FSNAU) cross-sectional household surveys conducted in rural areas of Somalia between 2014 and 2021. Anthropometric data from 85,837 children aged 6–59 months were surveyed across a total of 27,520 households. We supplemented the data from these surveys with cross-sectional nutrition surveys conducted by Action Against Hunger during the same period. FSNAU survey data were collected primarily around July and December, corresponding to the assumed timing of Somalia's Gu and Deyr seasons from 2014 to 2021.
First, the study population was divided into smaller geographical areas, such as villages. Clusters were then randomly selected from these villages, with the odds of any village being selected being proportional to the size of its population. Second, individuals were chosen randomly from within each village, with each person having an equal chance of being selected. We supplemented survey data with available secondary data on climate (e.g., normalised differential vegetation index (NDVI)), conflict events reported by active conflict location from the Armed Conflict Location and Event Data Project (ACLED) database, IPC food insecurity analysis, and stakeholder consultations.
The primary outcomes analysed in this study were child nutritional status (assessed using weight-for-height z-score (WHZ)), including child wasting (defined as WHZ threshold< 2 SD), and household food security (assessed using the Food Consumption Score (FCS)). Explanatory variables included various household- and community-level characteristics (number of camels, cows, sheep, and goats owned by households and the tropical livestock unit (TLU) calculation1), as well as spatial factors such as livelihood zone (defined by the Famine Early Warning Systems Network as proxies for production systems), and district and environmental factors (NDVI, rainfall, and ACLED conflict events).
We ran linear regression models for continuous and normally distributed variables (z-scores and FCS) and logistic regression models for binary outcomes (wasting or food insecurity). We analysed the community clustering of key outcome indicators using the intraclass correlation coefficient and average cluster size (Janjua et al., 2006). The design effect allows us to understand inter- and intra-‑village variability and comparability across key outcomes. A design effect equal to 1.0 suggests homogeneity within communities living in the same district and livelihood zone. Conversely, a design effect of 2.0 signals a variance twice as large as expected, indicating significant differences within or between these communities and reflecting a greater degree of diversity in the outcomes measured. Clusters were villages sampled within district and livelihood zones, and their design effect levels were incorporated into the model to allow for structured and unstructured heterogeneity of wasting (spatial and temporal).
The main limitation of this study is that areas for data collection were not consistent across Somalia, with a likely bias toward areas most affected by conflict. Data was unavailable on all key indicators likely affiliated with outcomes, such as ethnicity and clan affiliation. Geospatial coordinates were unavailable, limiting the granularity of the analysis.
Part 3:
Spatial variation in wasting and potential drivers
Wasting and food insecurity
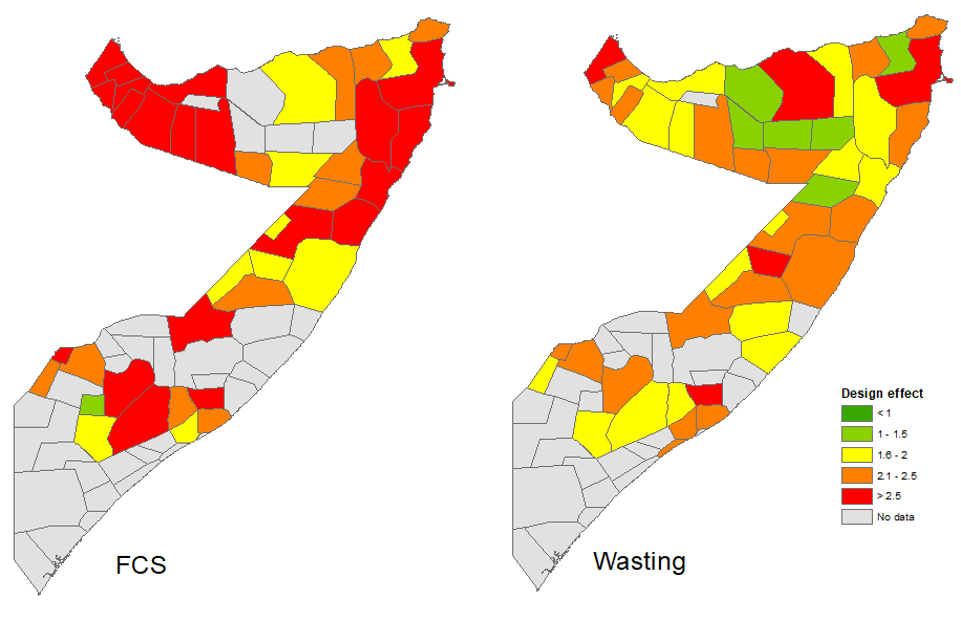
Our results show an apparent community clustering of wasting and household food insecurity across all livelihood zones and seasons, using the design effect as a proxy to assess spatial heterogeneity between sampled communities. Results below (Table 1 & Figure 1) suggest the presence of pockets or hotspots of child wasting and household food insecurity at the community level within the same district and livelihood zones. This indicates the central role of community-level drivers and district and livelihood zone drivers. The design effect for food insecurity is substantially higher than for wasting, especially for the pastoral livelihood zone (design effect of 5.2), suggesting that food insecurity is even more driven by community-level specific drivers.
Table 1: Estimation of design effect of child wasting by districts
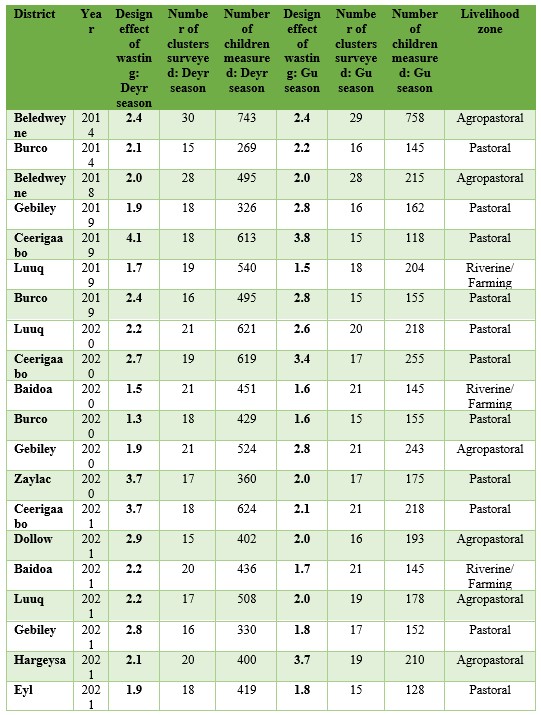
Figure 1: Estimation of the design effect of child wasting and household food insecurity by district
Livelihoods
While assessing income sources within districts located in riverine, agropastoralist, and pastoralist livelihood zones, we observed high heterogeneity in household and community production systems in the same district and livelihood zone. For example, in Belwendwe district (a riverine livelihood zone), 20.2% (95% CI, 16.8–23.9) of households rely on livestock as their primary source of income, with a design effect of 9.8. On the other hand, only 49.6% (95% CI, 45.3–53.9) of households living in Goldogob (a pastoralist livelihood zone) rely on livestock as their main production system, with a design effect of 8. The high design effect indicates that the reported main source of livelihood is clustered at the village level as opposed to the zone level, which is suggestive of more diversity within a zone but overall homogeneity within a village.
We looked at the spatial distribution of livestock using TLU to better understand the distribution of livelihoods and investments in livestock. We also performed a regression analysis on livestock ownership by household between 2014 and 2021 (Table 2). We observed that households in riverine and agropastoral zones had more livestock per household. In contrast, households in pastoralist areas showed decreased livestock ownership (mostly camels and small ruminants). We found that some agropastoral and riverine districts had higher numbers of TLU than districts in pastoralist areas. In 2021, the districts with the highest median of TLU by households were Balad Hawo and Dollow (riverine livelihood zones), followed by Baki, Berbera, and Boroma (agropastoral livelihood zones).
Table 2: Livestock ownership by households across livelihood zones and seasons – averages from 2014 to 2021
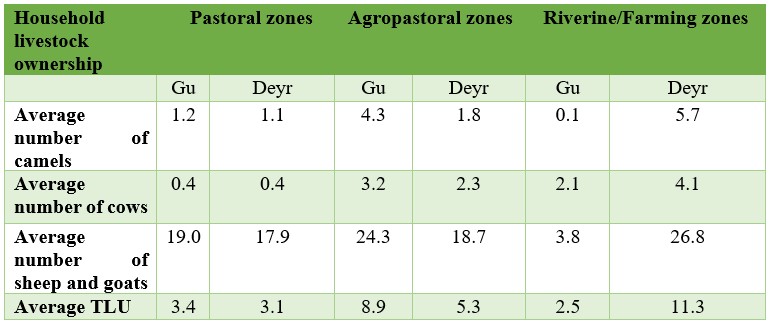
We also observed a more complex spectrum of pastoralist systems. The analysis of livestock owned showed a high diversity of herd composition (defined by species owned and average numbers of each species) across communities living in the same livelihood zones. Moreover, the study of the design effect (as a proxy of heterogeneity within surveyed districts) indicated that livestock ownership was clustered in specific communities across all livelihood zones (TLU design effect > 1.5 across all livelihood zones). Thus, the diversity of livestock management needs to be considered beyond just livelihood zones.
Rainfall, vegetation, and conflict
The rainfall distribution pattern in Somalia is influenced by several factors, including geographical location, topography, proximity to water bodies, and prevailing wind patterns. As a result, rainfall patterns can vary significantly from one village to another, leading to disparities and vulnerabilities to very localised floods or drought. Such differences exacerbate Somalia’s existing socio-economic and political dynamics as communities compete for scarce resources. It also affects population movements, as people may migrate to areas with favourable rainfall patterns or seek alternative livelihood options in response to droughts and water scarcity.
The spatial distribution of conflict across rural Somalia overlaps with some areas experiencing emergency levels of food insecurity and wasting. Clannism and clan cleavages are major sources of conflict that divide Somalis and generate competition for access to and control of resources, affecting livelihood specialisation and escalating conflict. Conflict can also affect food insecurity and wasting through other pathways, such as the destruction of and limited access to health services and malnutrition treatment centres, displacement, distribution of humanitarian aid, disruption of food production, and migration of livestock for pasture and water.
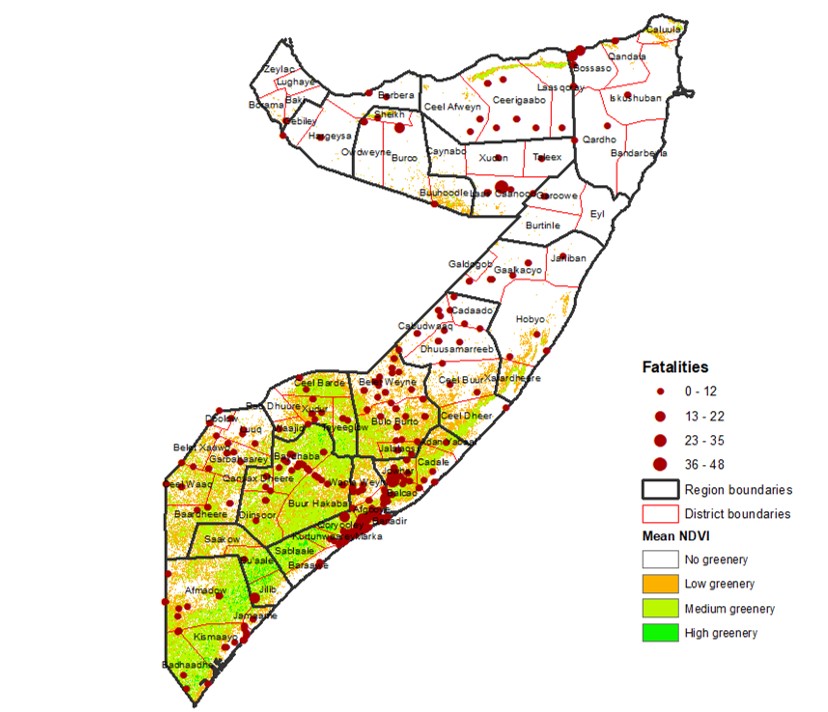
Studies indicate that conflicts are typically in riverine and agropastoral livelihood zones (Majid et al., 2022). Our spatial analysis of conflict events using ACLED data and NDVI in the month of May from 2017 to 2021 indicates that conflicts are clustered in south and central Somalia, where surface water and vegetation (as a proxy for water, pasture, or land for cultivation access) are available at that time of the year. This further underscores the importance of considering natural resource management when designing emergency response interventions in a context of competition between production systems (Figure 2).
Figure 2: Spatial distribution of conflicts and vegetation in Somalia from 2017 to 2021 (source: ACLED)
Part 4:
Temporal variation of wasting
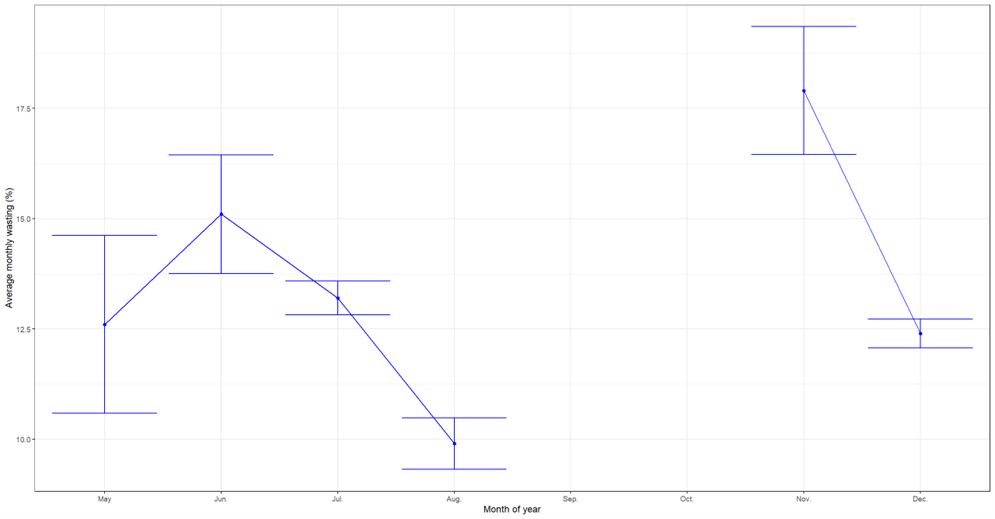
It is commonly assumed that wasting prevalence follows the seasonal pattern of food insecurity, with worsening conditions at the end of the Jilaal dry season until harvesting in August and September. However, we identified two seasonal peaks of child wasting in Somalia in May/June (the beginning of the Gu rainy season) and November (mid-Deyr rainy season), with a decline in child wasting in between (during the lean season) (Figure 3). Furthermore, we observed minimal year-to-year variability in wasting prevalence from 2014 to 2021 in rural Somalia.
Figure 3: Seasonal variation of child wasting in Somalia by months
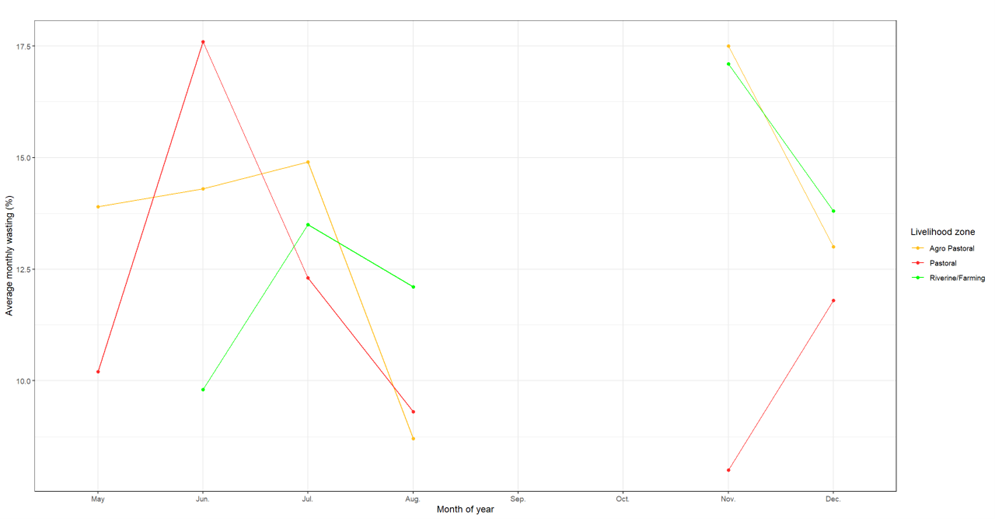
We observed a difference in the seasonal patterns of child wasting by livelihood zones. In pastoralist areas, the first peak of wasting in June (Gu season) does not match the lean season because the pastoral consumption year starts with the onset of the Gu rainy season (April) when most species give birth, and households have access to their own milk and meat and income for other essentials from saleable animals. The second observed peak in November – after the Gu harvesting (August–September) when food insecurity should be at its minimum – mainly affects farming and agropastoralist zones (Figure 4). However, children living in agropastoralist zones seem vulnerable to both peaks. The temporal distribution of child wasting by sex in Somalia indicates that boys are significantly more vulnerable to wasting than girls across all seasons and livelihood groups. However, boys seem to be more affected by seasonal variations of wasting, especially across riverine livelihood zones.
Figure 4: Child wasting prevalence per livelihood zone
Different patterns of wasting and food security trends
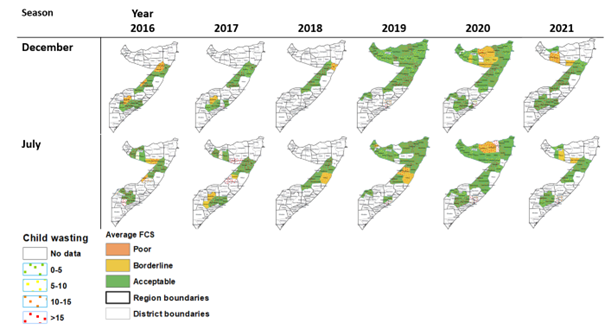
When looking at the spatial distribution of food insecurity, districts with higher levels of child wasting did not match those affected by poor food security over seasons and years. Stakeholders (from interviews of food security cluster partners in Somalia, May 2022) also noted that the nutrition situation in Somalia has not always been responsive to changes in the food security indicators, suggesting other factors are at play (Figure 5).
Figure 5: Space–time distribution of child wasting and food insecurity
Part 5:
Discussion
Humanitarian, development, and peace actors require comprehensive information about who will likely experience wasting and food insecurity in Somalia and why. While general risk trends are well understood, adjusting the humanitarian responses and interventions requires a detailed and accurate understanding of how different populations are affected. Our work has shown a spatiotemporal disconnect between food insecurity and wasting both across and within livelihood zones in Somalia. This calls for more attention to collecting and analysing data in a way that captures context-specific spatial and temporal variations in food insecurity and wasting.
Using the design effect as an outcome instead of a correction in nutrition survey analyses enables us to more thoroughly investigate the degree to which community-level factors – rather than household- or individual-level ones – operate at the household or individual level. The design effect of the primary outcomes and basic drivers within communities shows that wasting, food insecurity, livelihood specialisation, conflict, vegetation, and rainfall are highly clustered at the community/village level. The apparent clustering of the outcome indicators likely implies that major drivers of food insecurity and wasting are prominent and distinctive at the community and livelihood zone levels.
Our analysis shows the heterogeneity of livelihood specialisation across the different livelihood zones and their high complexity compared to what is often assumed with the categorisation of homogeneous zones. Our results highlight the critical need to consider various scenarios to better analyse, forecast, and implement early action for resilient livelihoods and to prevent extreme food insecurity and wasting, including famine risk. In this sense, analysis of livelihood systems should move beyond blanket categorisations of livelihood zones and districts and instead focus on the broad and multifaceted combinations of livelihoods and income activities within each livelihood zone.
Our study found that seasonal wasting patterns differ from seasonal patterns of food insecurity. Different patterns between food security and wasting have also been observed in several Sahelian countries with unimodal rainfed systems (FAO & Tufts University, 2019). This underscores the crucial role of understanding seasonal drivers of child wasting beyond annual patterns of households' food insecurity.
Furthermore, our data show a complex relationship between wasting and food insecurity across individuals, households, communities, and livelihood zones, indicating different drivers for each. This study's results suggest that the assumption of food security being the primary causal factor of wasting may be incorrect. This may bias crisis modelling and affect projections, which in turn may affect response efforts.
Instead, this study has shown that efforts to prevent wasting must move beyond food-centred approaches to include multisectoral and integrated responses. Particular attention must be given to fundamental drivers such as environment and seasonality, institutions, and livelihood systems – as highlighted in the updated conceptual framework for child wasting in Somalia (Young, 2020) and the geographical clustering of food insecurity and malnutrition (Luc et al., 2023). However, implementing localised and integrated programmes remains challenging in a context of fragmented international cooperation. Despite evidence that livelihoods, conflict, access to natural resources, and wasting are linked, international aid tends to overlook these dynamics and operate in silos focusing on the immediate drivers. Humanitarian, development, and peacebuilding efforts should be coordinated in a nexus approach to the design and implementation of programmes, address multisectoral challenges, and propose solutions that integrate considerations across sectors (FAO, Development Initiatives & Norwegian Refugee Council, 2021).
Furthermore, while experts play a major role in the decision-making process, the centralisation of analysis often leads to poor consideration of communities’ knowledge, perspectives, and local dynamics over time, impairing analysis, forecasting, and programming. Ultimately, reducing the spatial extent of the nutrition and food security analysis to create local models focused on environmental indicators for specific groups can improve our ability to forecast and respond to hunger. A new approach focusing on understanding these crises as complex local systems would offer the possibility of understanding the interacting dynamics that lead to different community outcomes.
For more information, please contact Gwenaelle Luc at Gwenaelle.Luc@fao.org
References
Chotard S, Mason JB, Oliphant NP, et al. (2010) Fluctuations in wasting in vulnerable child populations in the Greater Horn of Africa. Food and Nutrition Bulletin, 31, 3, S219–S233.
FAO, Development Initiatives & Norwegian Refugee Council (2021) Development actors and the nexus: Lessons from crises in Bangladesh, Cameroon, and Somalia. fao.org.
FAO & Tufts University (2019) Twin peaks: The seasonality of acute malnutrition, conflict and environmental factors – Chad, South Sudan and the Sudan. fao.org.
IPC (2024) Somalia IPC acute malnutrition (IPC AMN) trends (2016 Gu–2023 Deyr). fsnau.org.
Janjua NZ, Khan MI, & Clemens JD (2006) Estimates of intraclass correlation coefficient and design effect for surveys and cluster randomized trials on injection use in Pakistan and developing countries. Tropical Medicine and International Health, 11, 12, 1832–1840.
Kinyoki D, Moloney G, Uthman O, et al. (2017) Conflict in Somalia: Impact on child undernutrition. BMJ Global Health, 2, e000262.
Luc G, Keita M, Houssoube F et al. (2023) Community clustering of food insecurity and malnutrition associated with systemic drivers in Chad. Food and Nutrition Bulletin, 44, Suppl 2, S69–S82.
Majid N, Jelle M, Adan G et al. (2022) Another humanitarian (and political) crisis in Somalia in 2022. Feinstein International Center. fic.tufts.edu.
Martin-Canavate R, Custodio E, Yusuf A, et al. (2020) Malnutrition and morbidity trends in Somalia between 2007 and 2016: Results from 291 cross-sectional surveys. BMJ Open, 10, 2, e033148.
Young H (2020) Nutrition in Africa’s drylands: A conceptual framework for addressing acute malnutrition. Feinstein International Center. fic.tufts.edu.
About This Article
Download & Citation
Reference this page
Gwenaelle Luc, Modibo Keita, Baguinébié Bazongo, Brahima Diarra, Angelina Virchenko, Claudia Okley, Tiphaine Seyvet, Yannick Ngongang Mbunang, Daniel Molla, Dunja Dujanovic, Abukar Nur, Anastasia Marshak, Afaf Rahim & Abdal Monium Osman (2024). Special focus: Wasting patterns in Somalia. Field Exchange Magazine 72. https://doi.org/10.6084/m9.figshare.25552191